For years I have heard about Grafana but never really played with it... until now!
At the beginning the task was to explore a solution to monitor Amazon Connect in real time, which has been splendidly done on a great AWS blog post by Mehmet Demir and Imaya Kumar Jagannathan.
Did you know that these dashboards were even possible? On Connect?? Just... wow!
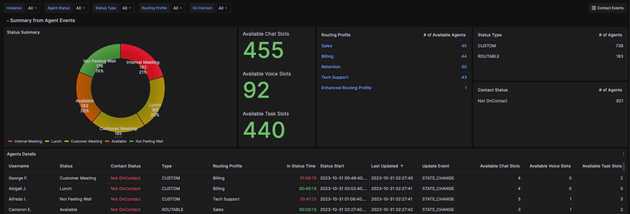
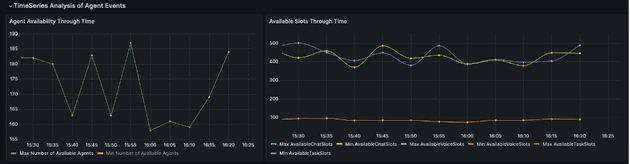
But, apart from the basic implementation of what was written on the blog post, playing around made me realise how much more powerful that tool was... It has so many ways to be customised and so many different data sources or plug in to install that.. the possibilities are virtually endless (provided one would spend enough time to discover and play!).
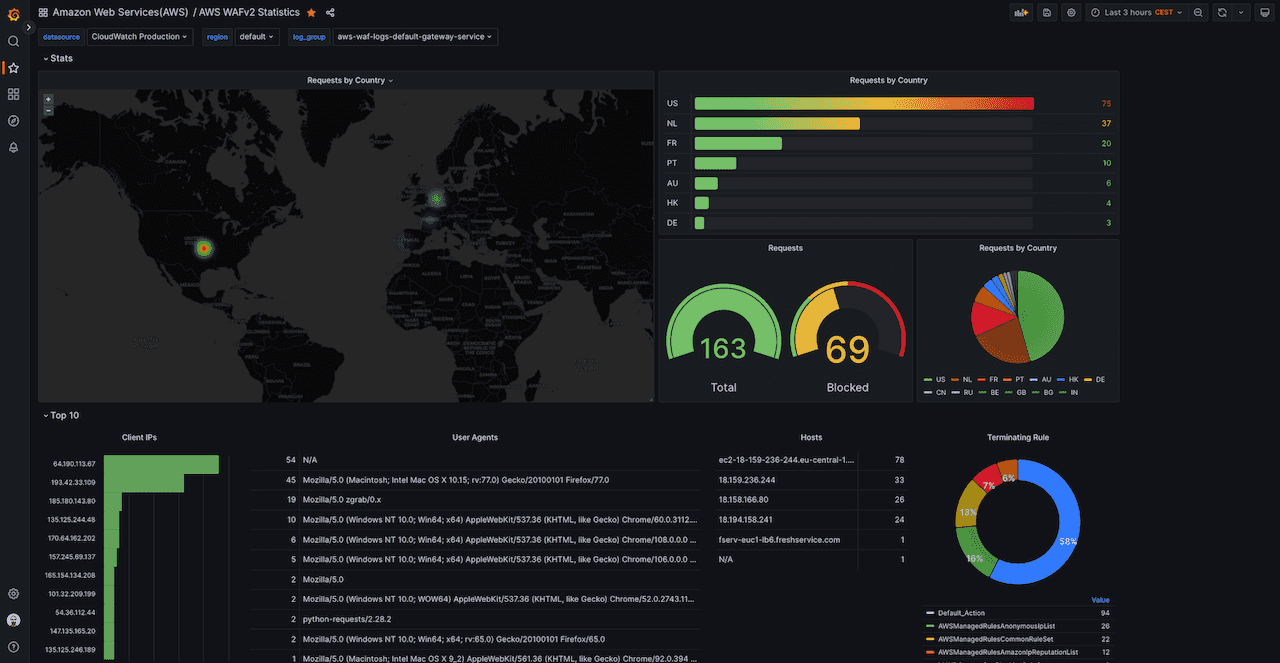
While the intance was there up and running I then attempted to plug Cloudwatch on it. Oh boy. Impossible for me to go back to Cloudwatch dasboards now. How could I? Here below is WAF metrics, taken straight from Grafana. A-M-A-Z-I-N-G
To be continued...